You already have the content.

A category review deck from last quarter.
A product sheet.
A research PDF.
A YouTube training recording.
A few links your team keeps forwarding.

What you do not have is time. Especially when every request comes with a new deadline.

NotebookLM’s new Studio style workflow turns decks and infographics into a first draft problem. That is useful, but it only becomes valuable when you pair it with creative direction, brand rules, and a simple QA loop.

This guide shows the straight path.
What you can create in NotebookLM Studio
- Infographics: a visual summary from a PDF, a set of URLs, or a transcript.
- Slide decks: a structured presentation built from your sources.
Think of Studio as a draft engine. Your job is to make the draft shippable.
Screenshots to include in your article
- NotebookLM “Sources” panel with your inputs loaded
- Studio “Infographic” and “Slide deck” options
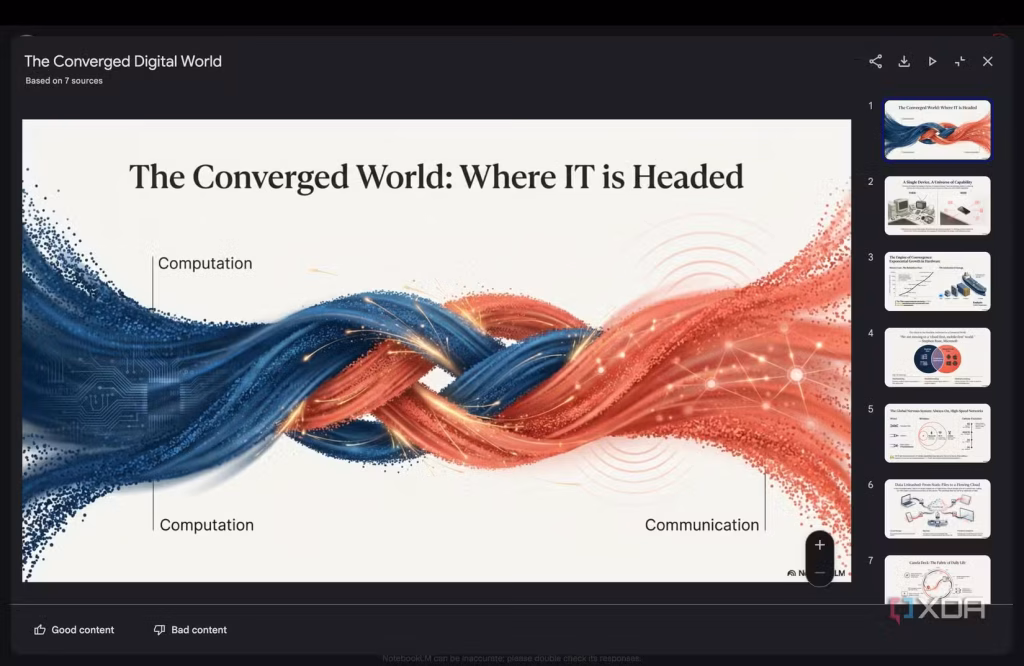
- A generated deck preview, plus export options

Part 0: Set up your source pack (do this once, reuse forever)
NotebookLM is source-led. The output quality is highly correlated with input quality.
1) Pick one lane.
Do not start with “a deck for everyone.” Start with one:
- Retail sell-in deck
- Internal training deck
- POV carousel (LinkedIn style)
2) Build a “truth layer” document.
One page that includes:
- Approved product names, SKUs, specs
- Claims you can use, plus claims you cannot use
- Market differences (if any)
This is how you prevent errors in your slides.
3) Keep your source pack tight.
Aim for 5 to 12 items:
- 1 PDF (brief, research, guideline)
- 3 to 5 URLs (reliable references)
- 1 transcript (training, webinar, interview)
- 1 example deck you like (structure reference)
Part 1: Turn a PDF into an infographic and a slide deck
This is the simplest workflow and the fastest way to test quality.
Step 1: Create a notebook and upload the PDF.
Use the cleanest, most final version you have.
Step 2: Open Studio and generate an infographic draft.
Use this prompt style:
Prompt (Infographic)
“Create an infographic that explains the key framework in this PDF. Keep it scannable for business readers. Use 5 to 7 blocks max. Include definitions only if essential.”
Step 3: Generate a slide deck draft from the same PDF.
Decide what kind of deck you need:
- Presenter deck: fewer words, meeting-friendly
- Self-reading deck: more detail, follow-up friendly
Prompt (Slide deck)
“Create a slide deck for a senior business audience. Structure it as: context, key insight, implications, recommended actions. Keep each slide to one message. Only use information supported by the PDF.”
Step 4: Export and move into your brand template.
Treat the export as raw material. The brand system comes next.

Part 2: Turn multiple URLs into a comparison deck
This is the most realistic “modern work” scenario. Your team already works from links.
Step 1: Add 3 to 5 URLs on one topic.
Do not mix unrelated links. Keep the question tight.
Step 2: Ask for a comparison infographic first.
Infographics force clarity.
Prompt (Comparison infographic)
“Compare these sources in a side-by-side infographic. Use columns for: what it is, when to use it, strengths, limitations, practical examples. Keep language non-technical.”
Step 3: Generate the deck from the infographic logic.
You want the same structure, expanded.
Prompt (Comparison deck)
“Turn the comparison into a 10-slide deck. Slide 1 is the POV. Slides 2 to 8 are the comparison. Slide 9 is recommendations. Slide 10 is next steps.”

Part 3: Turn a YouTube video into a training deck
Video is where knowledge hides. This is where draft generation saves real time.
Step 1: Add the YouTube link.
NotebookLM will use the transcript as the source.
Step 2: Generate a training-first deck.
Training decks fail when they are summaries. They win when they teach a sequence.
Prompt (Training deck)
“Create a training deck from this transcript. Include: learning objectives, key concepts, step-by-step process, common mistakes, and a short checklist at the end. Keep it practical for a team that needs to execute.”
Step 3: Create a one-page infographic recap.
This becomes your SOP visual.
Prompt (Training infographic)
“Create a one-page infographic summarising the process steps and checks. Make it usable as an internal SOP.”

The shipping layer: what to QA every time
This is where most teams lose trust. The deck looks finished, but it is subtly wrong.
Run a simple QA pass:
- Truth: names, SKUs, specs, timing
- Claims: every number and promise is supported by a source
- Narrative: one storyline, no filler slides
- Brand voice: terminology, tone, what you never say
- Design rules: typography, hierarchy, logo use, spacing
- Localisation: language and market context, not just translation
HubStudio POV: first drafts are cheap, trust is not
NotebookLM makes it easy to produce more decks and infographics. That is not the win.
The win is building a repeatable lane where:
- sources are curated,
- drafts are generated fast,
- QA protects accuracy,
- and brand templates make output consistent across markets.
At HubStudio, we set up this lane end-to-end, from source pack design and prompt libraries to brand templates, QA rules, and production workflows that can actually run at scale.